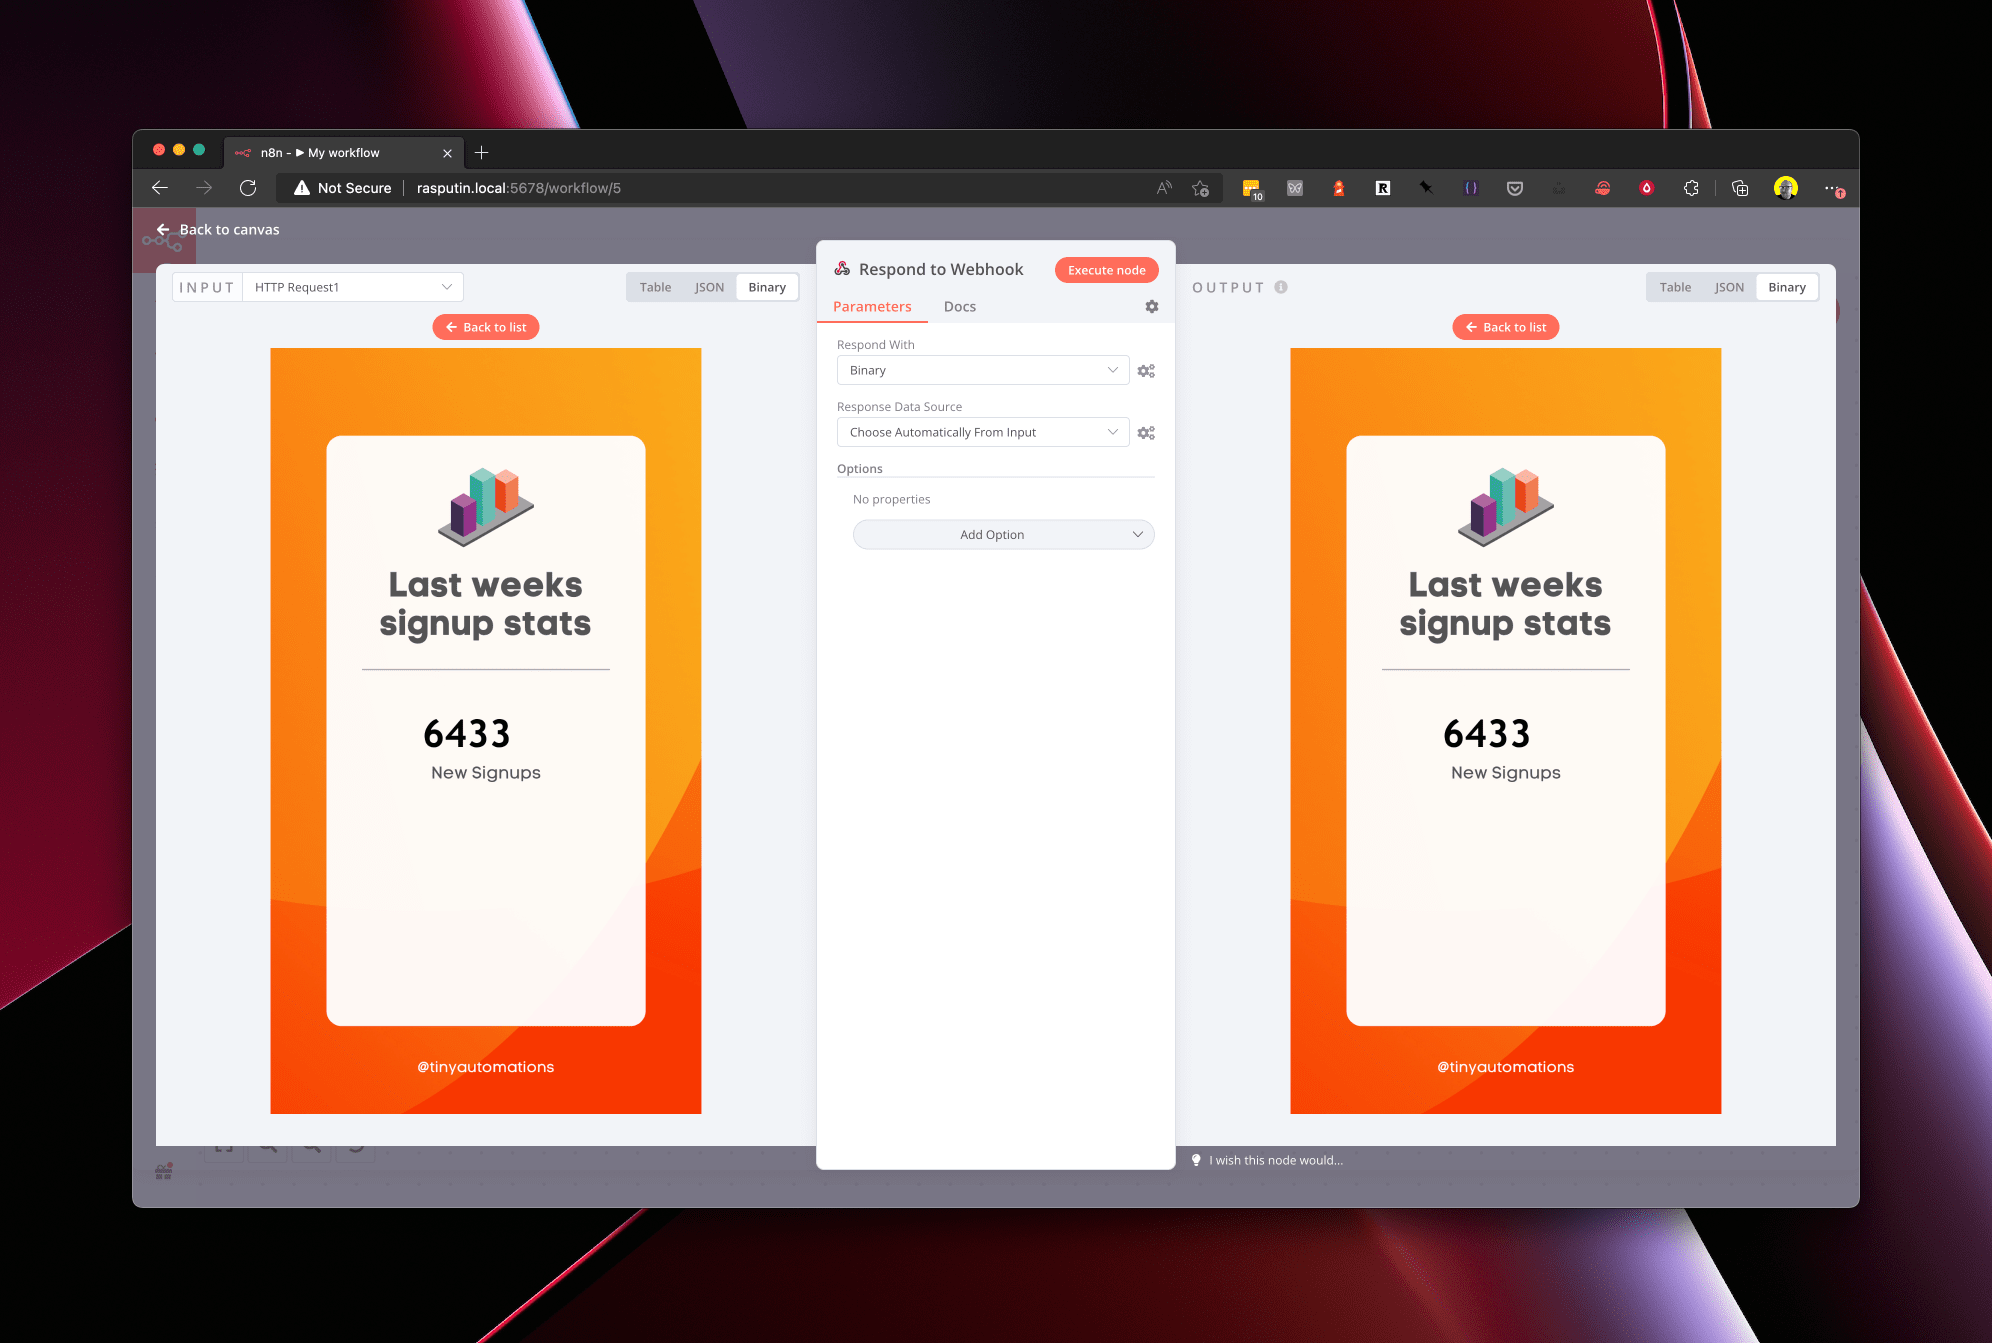
Dynamically create an infographic with Excel data
Overview
We combine our Creating a dynamic infographic and Using Make as an API for Excel tutorials to show you how to dynamically create an Infographic using your Excel data.
We use n8n to first hit a Make scenario to get Excel data and then we pass that data to a different n8n workflow to dynamically create an infographic.
Flow
How to recreate this automation
Resources
Step 1: Create an n8n workflow
Create a new workflow in n8n. Your final workflow will end up looking like this:
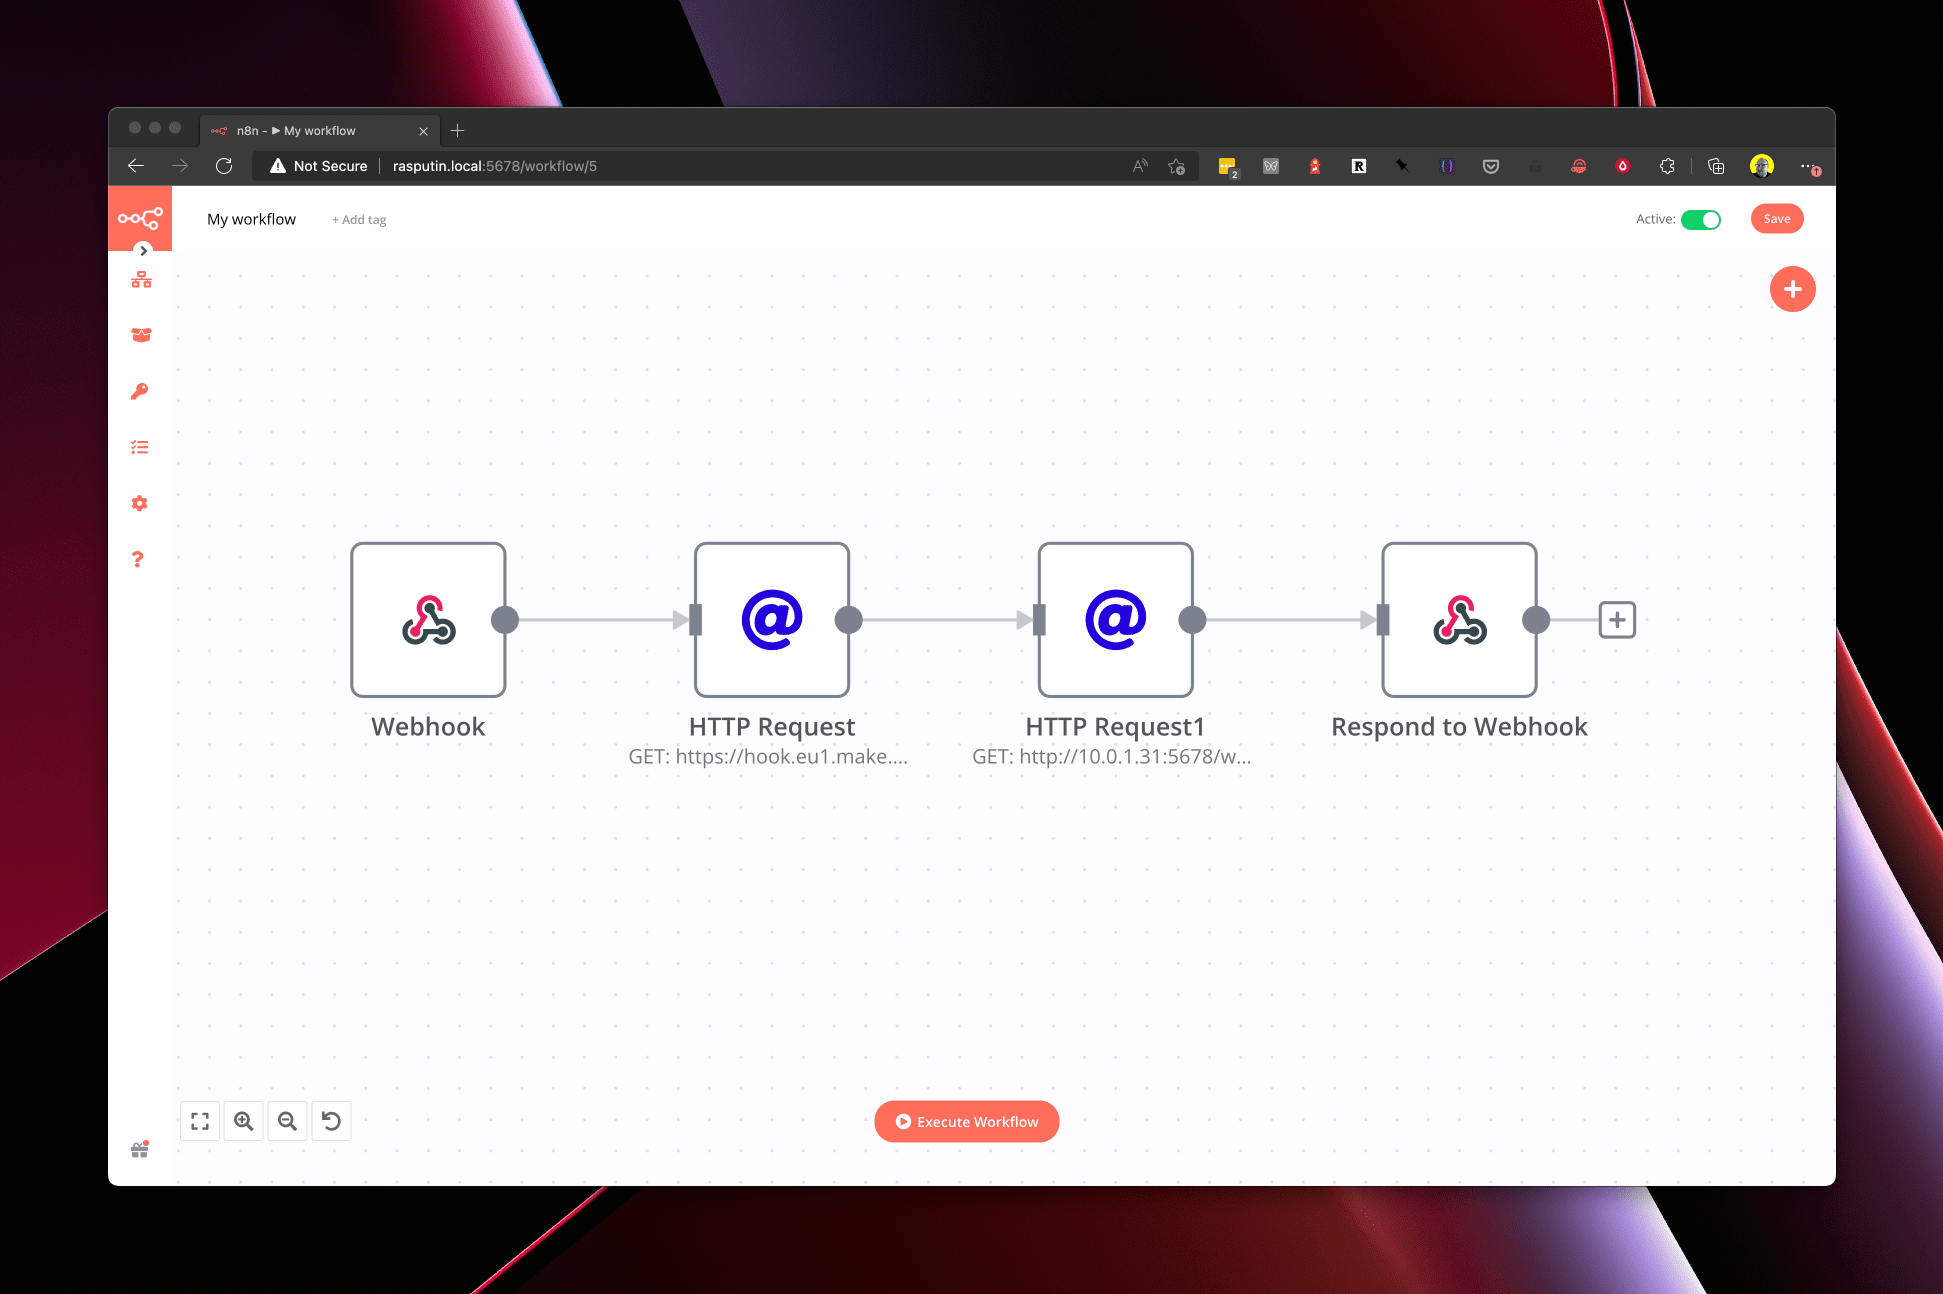
The workflow consists of 4 nodes.
- The first node is the Webhook that you call to kick off the workflow.
- The second node (a HTTP Request) calls the Creating a dynamic infographic workflow and returns Excel data.
- The third node (another HTTP Request) calls the Using Make as an API for Excel n8n workflow whilst passing in the data from the previous node.
- The final node returns the image to the user.
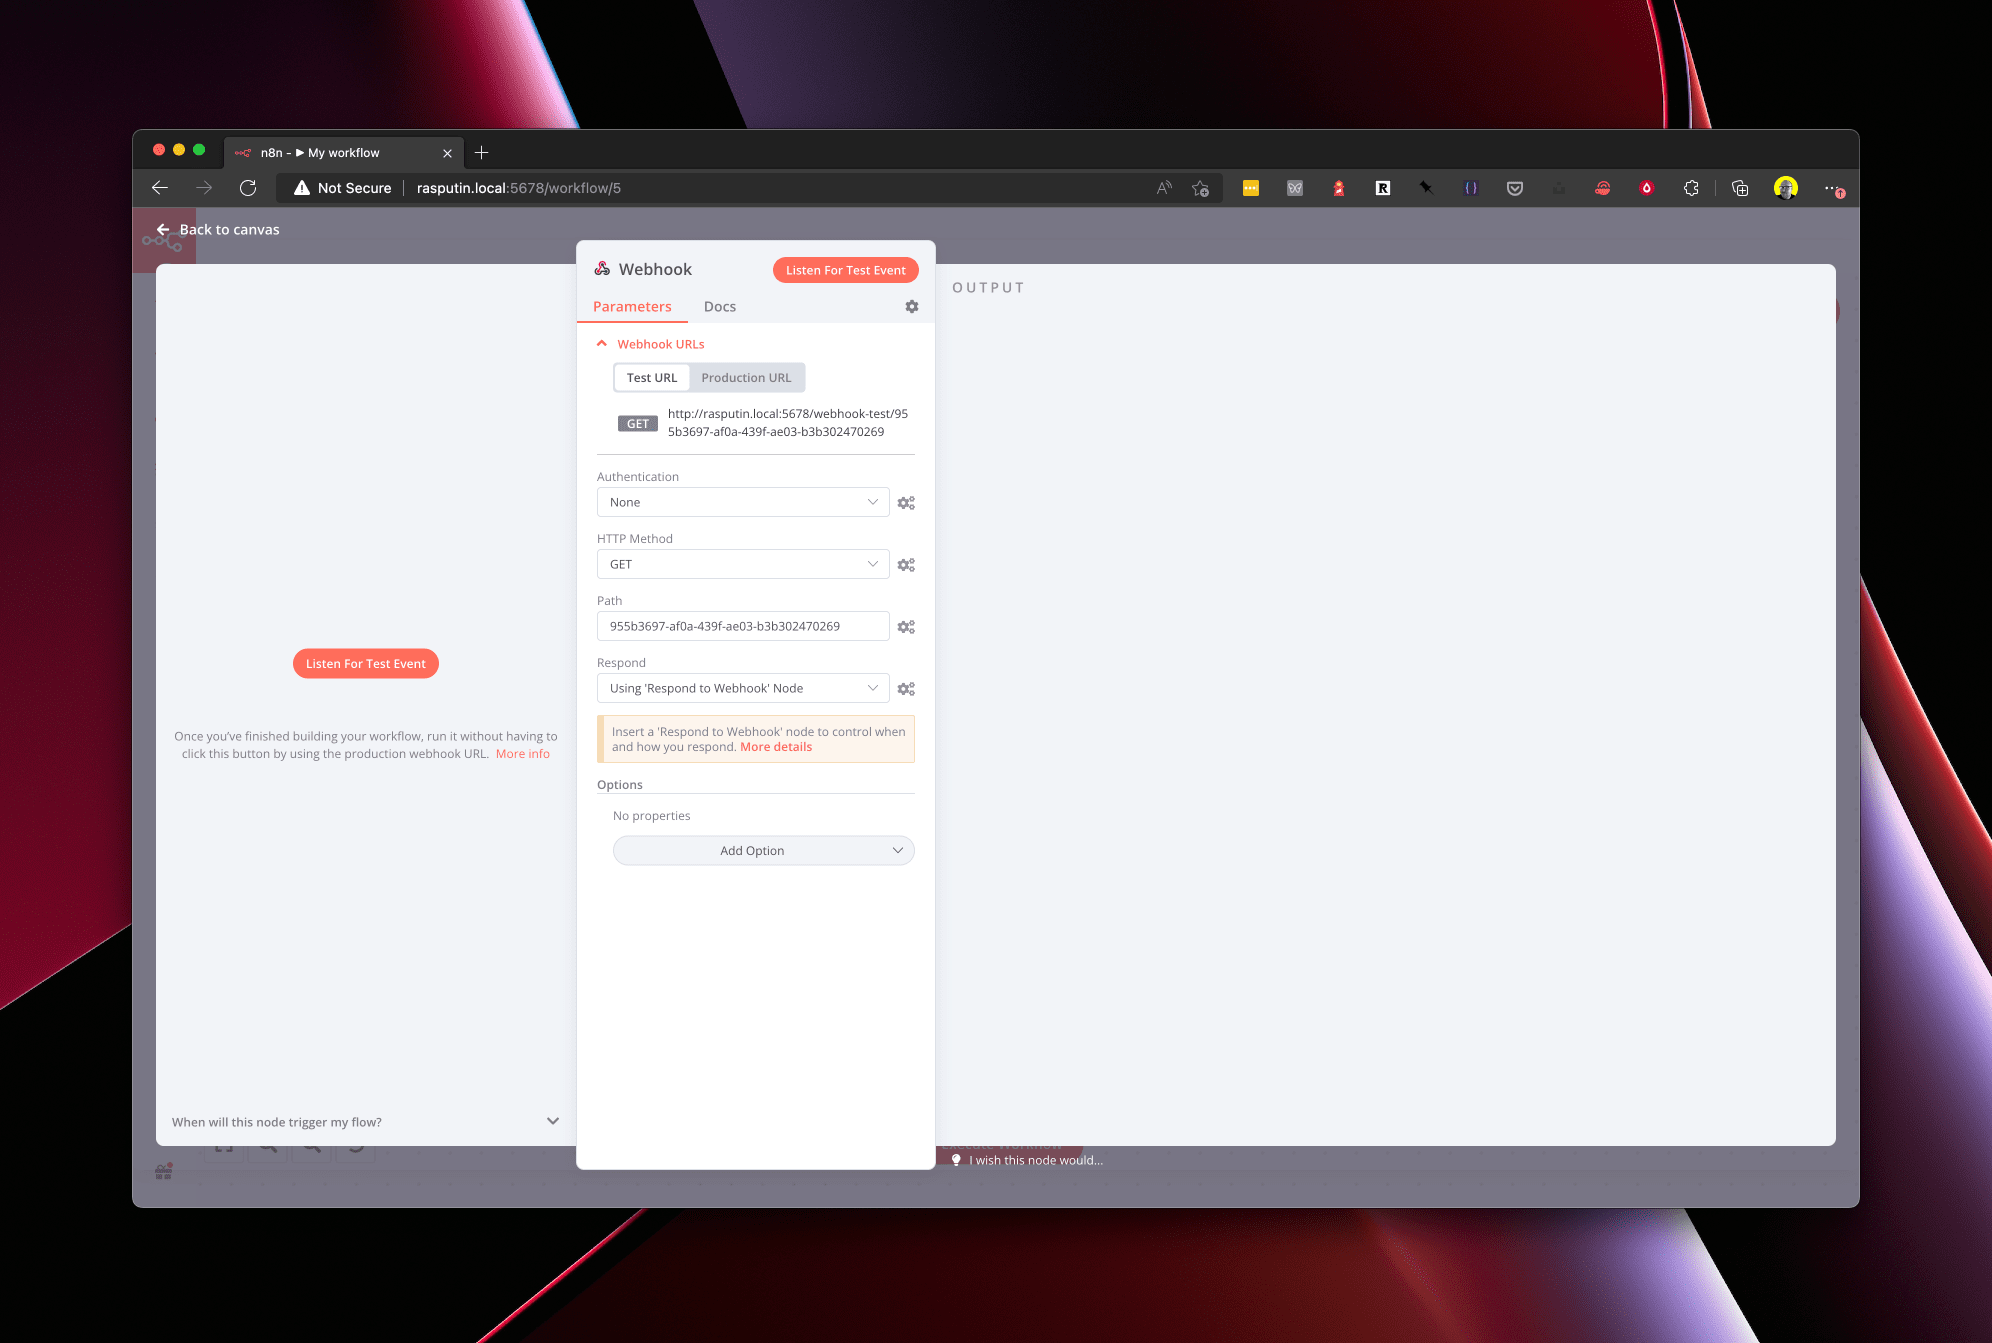
Step 2: Create a Webhook node
Create a Webhook node in your n8n workflow. Set the Respond value to Using 'Respond to Webhook' Node. This makes sure that the whole workflow will get executed before returning an image combined with Excel data.
Step 3: Run the Make workflow
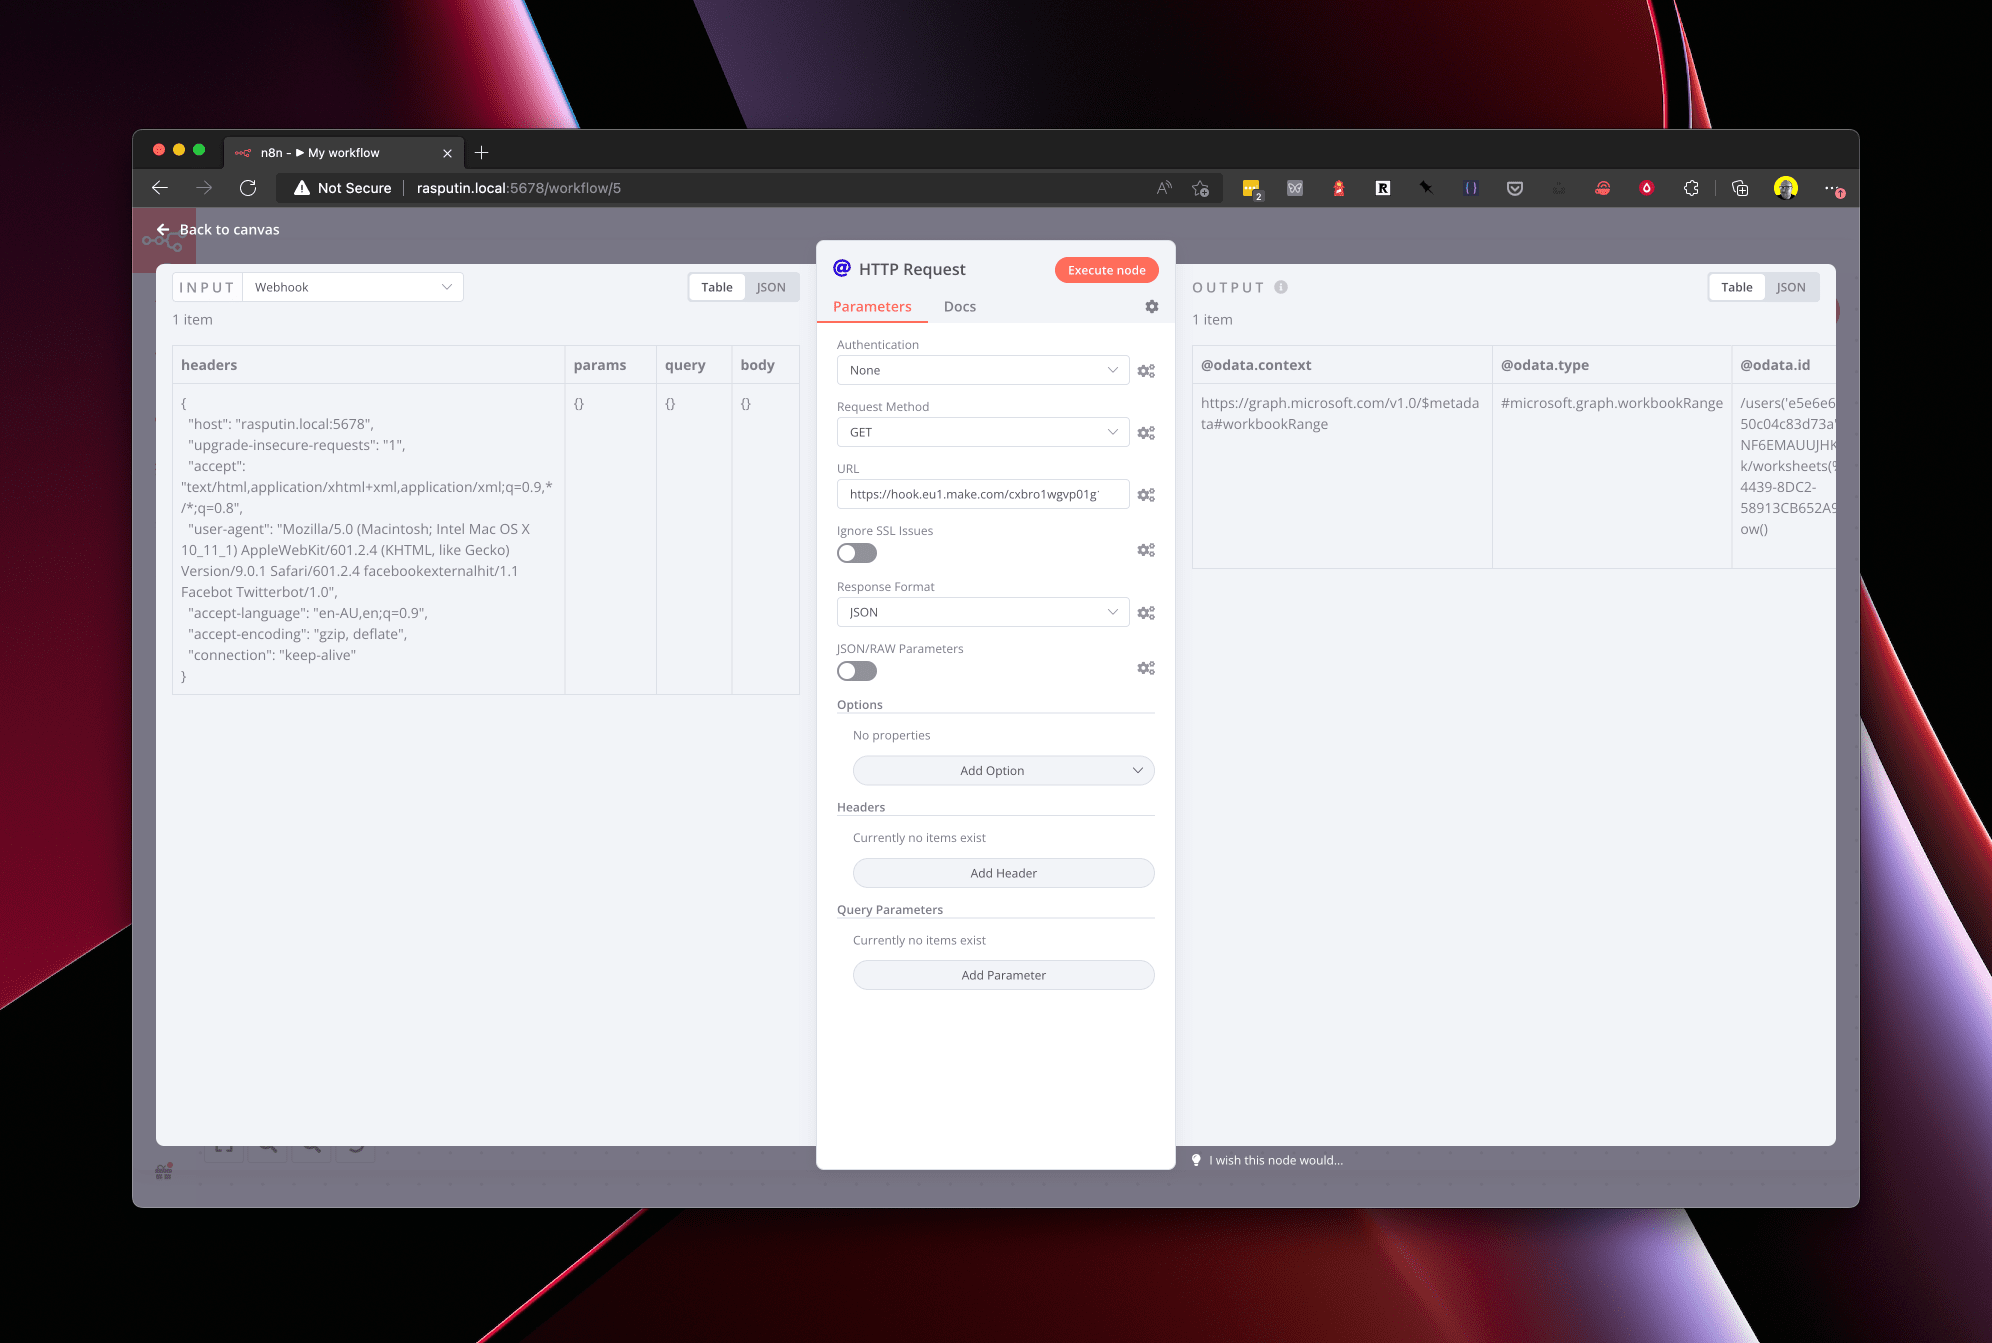
Create a HTTP Request node that calls your Make scenario. This will return JSON data of your Excel spreadsheet.
Step 4: Call your infographic n8n workflow
Create a HTTP Request to call your n8n workflow.
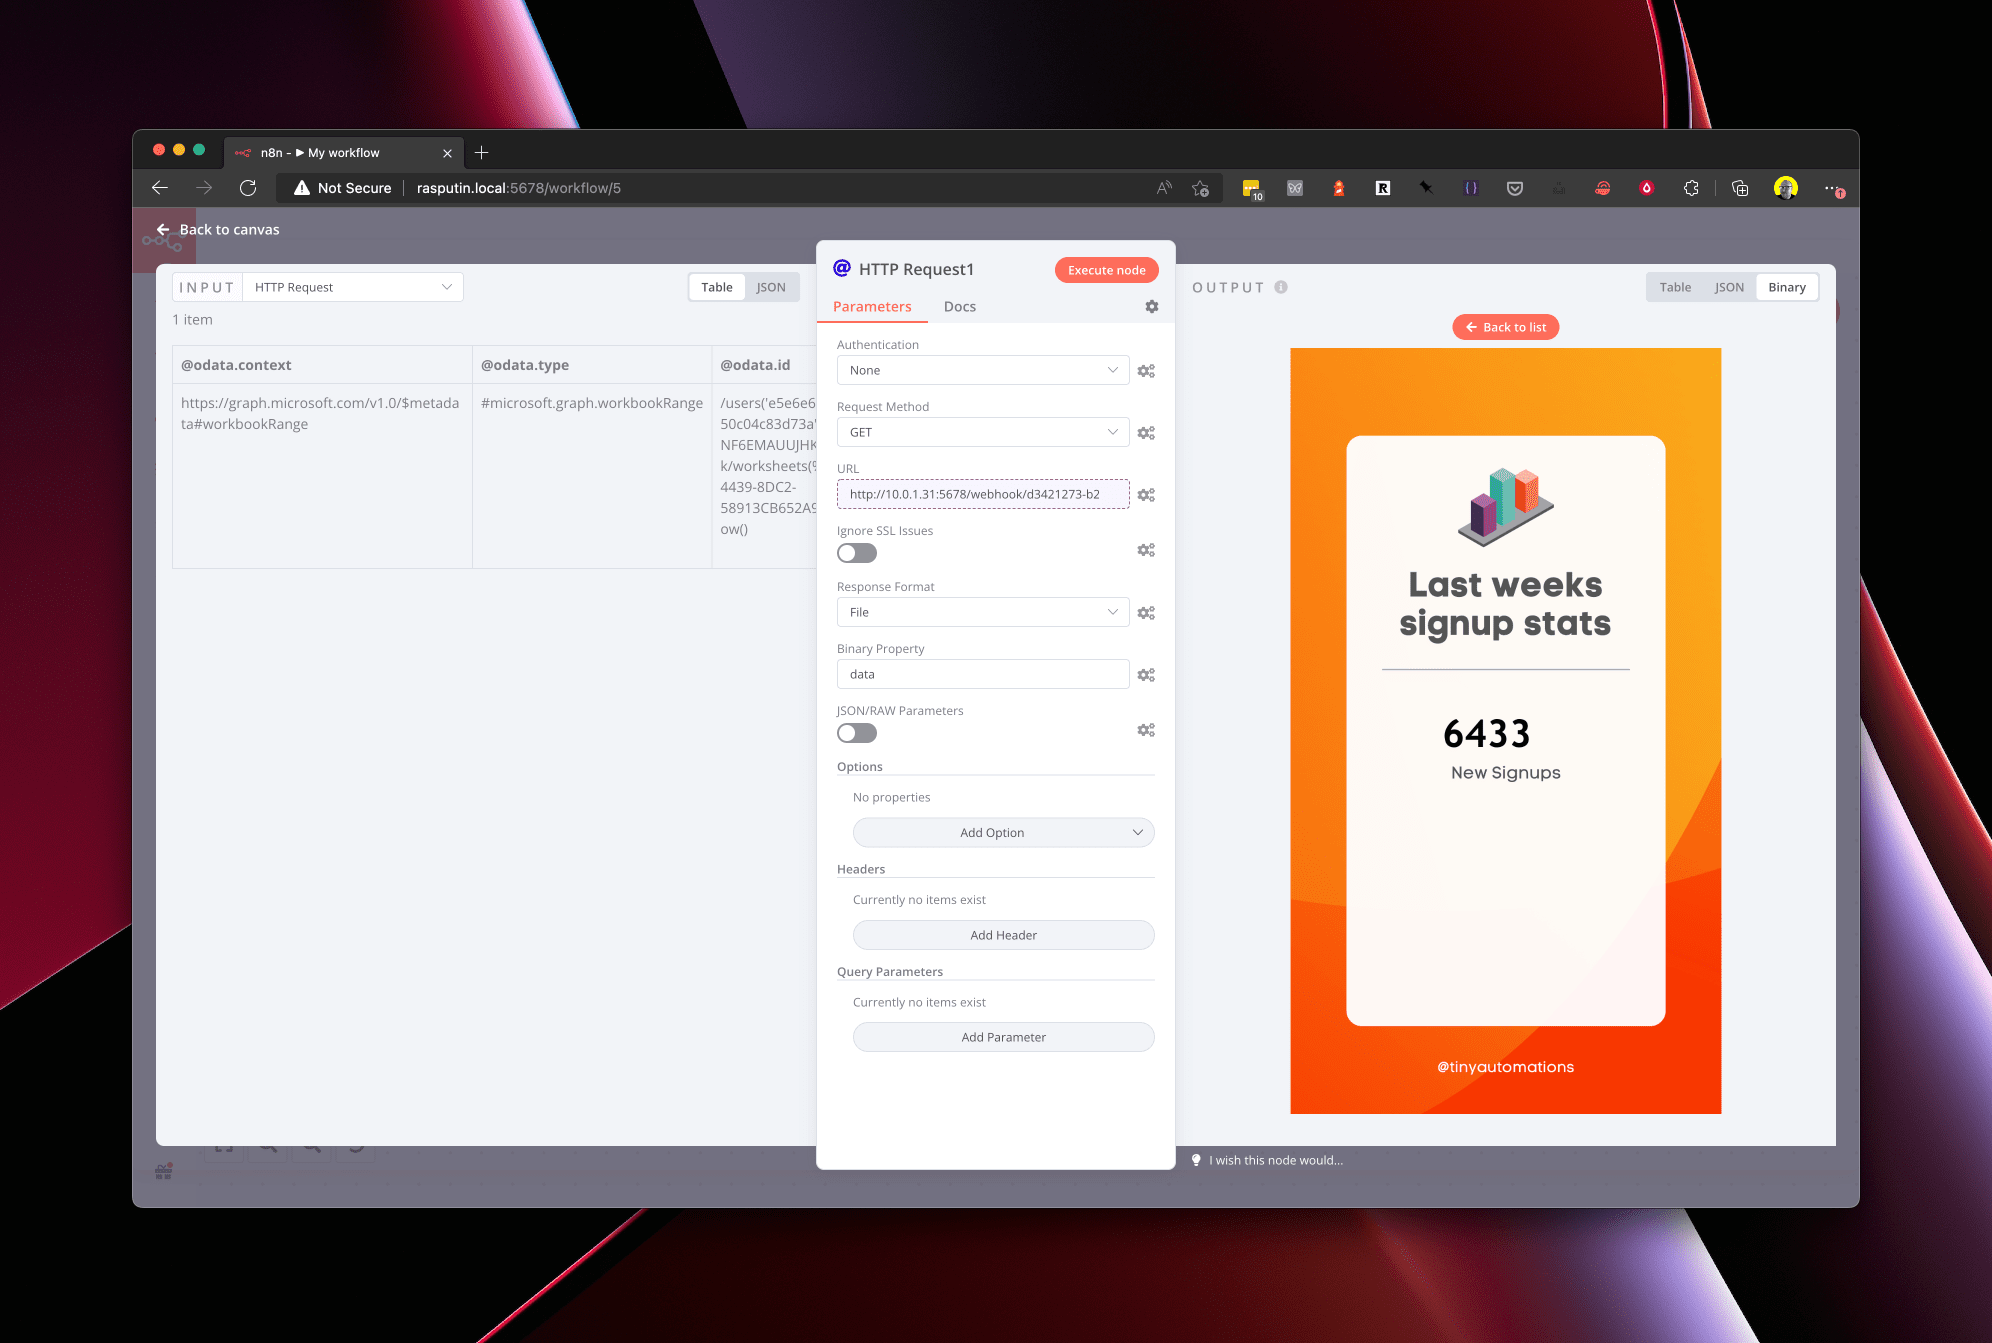
You will need to add a query parameter to the URL - you can do this using the expression editor to select the data coming through from Excel as JSON in the previous step. Your expression should look something like this:
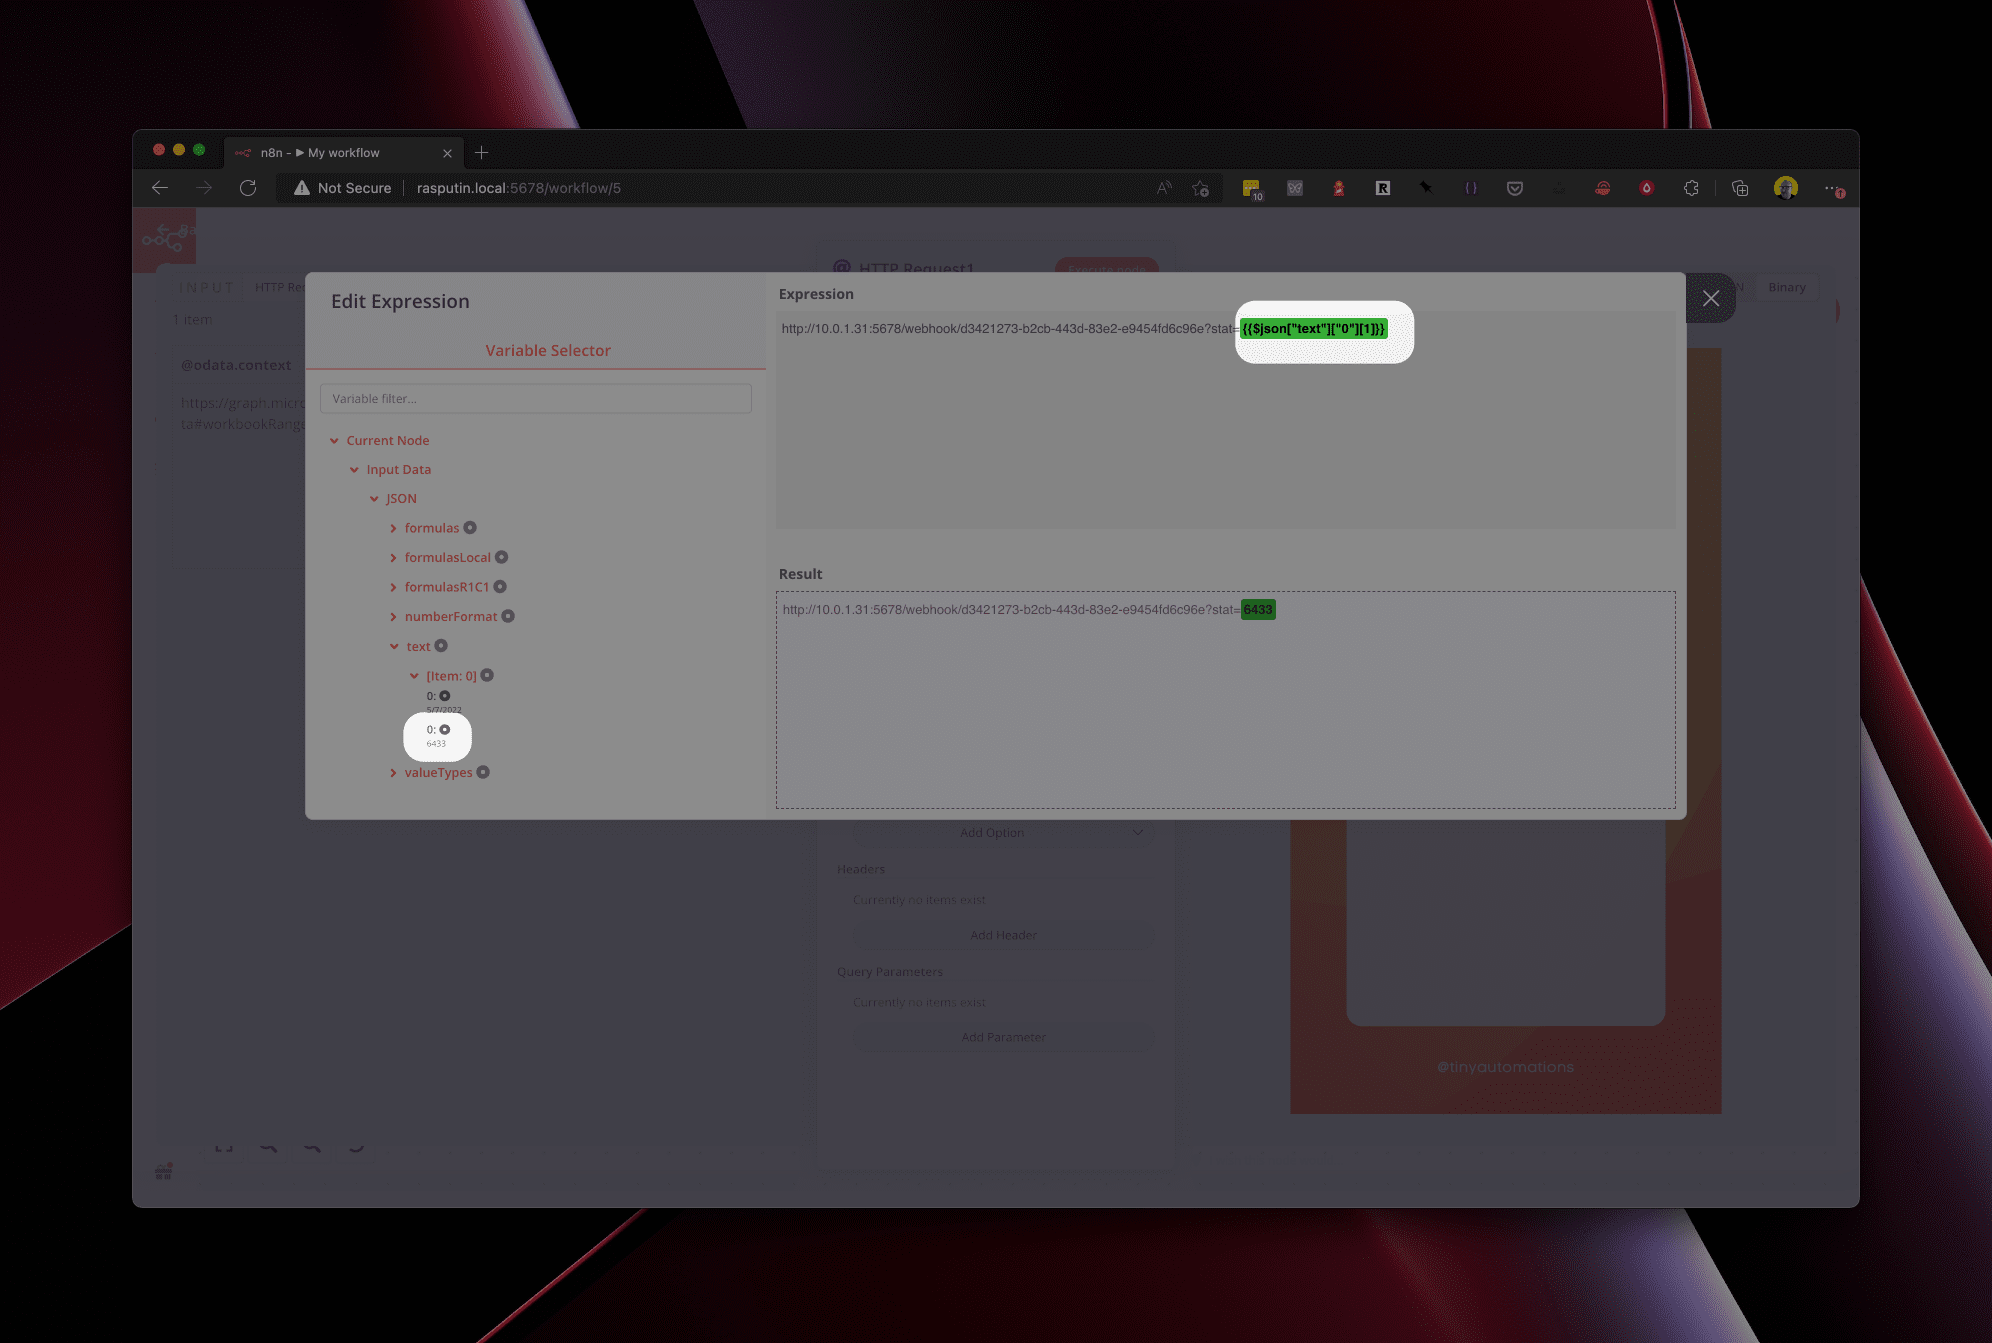
Step 5: Return the image to the user
Return the image to the user/browser - you do this by creating a Respond to Webhook node with the Respond With set to Binary and automatically choosing the data source from Input.
